
Top 10 Most Important Metrics For Mobile Apps

Do you want to know the most important metrics for mobile apps? If yes, then you need to read the rest of this post.
App marketers realize that you can’t improve something that you don’t measure. In order to make data-driven decisions, you need to track and measure the performance of your app.
However, with so many metrics and key performance indicators (KPIs), it can easily become confusing.
Not all metrics are equally important. If you have limited time, energy, and resources, you definitely want to focus on the metrics that matter the most.
Thus, in this post, let us go through the 10 most important app performance metrics you need to track for mobile apps.

1. Impressions
Impression refers to how many times users saw your app or ad. As you can imagine, impressions are crucial app metrics for acquisition.
If users can’t find your app, the opportunity to convince them to install your app will be lost. It simply ends there.
Thus, measuring your impressions has a huge impact on your mobile app metrics.
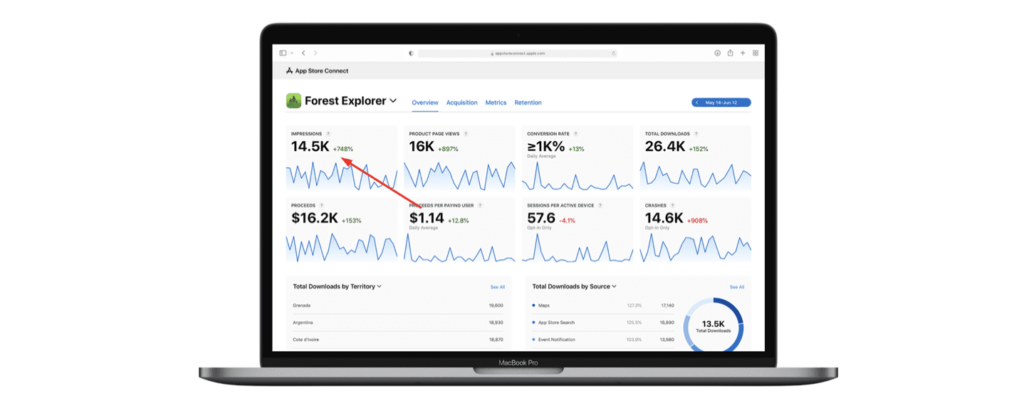
Image source: Apple Developer
Impressions are readily measured by app store analytics. So, this is something you can easily measure. With higher the impressions, the higher your visibility is on the app store.
2. Installs
Now that you have your user’s attention, you need to measure how many of them actually install your app. When you’re just starting out, your first goal is not just for users to see your app, but for them to download your app.
Paying close attention to your installs can tell you a lot of things.
A higher number of installs usually mean that your app is doing great.
Lower installs could mean that you have fewer people know about your app or people are not easily impressed with what they initially see or read about your app.
While you’re looking at your installs, determine as well where people are coming from.
How do users find you? Who refers them to you? Are they from your website, app listing page, or social media sites? These are vital pieces of information that you need to take note of to get more users in the future.
3. Conversion rate
You know your impressions and installs. You can now compute your conversion rate.
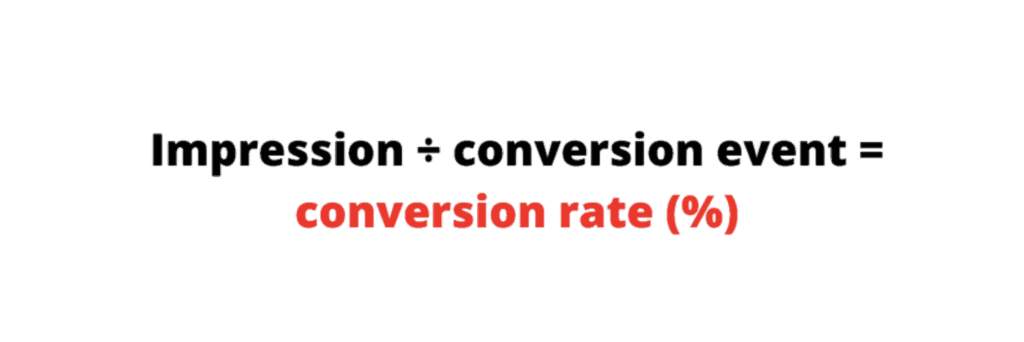
The conversion rate measures the number of people who interact with your app (impression) versus the number of people who perform your desired action (conversion event, ie., installs).
To calculate the conversion rate, you simply have to divide the conversion event by impression, then multiply by 100.
As you can imagine, app metrics for conversion are vital to your app’s success. The higher your conversion rate, the more effective your marketing campaign is.
Now, there are different ways that conversion rates can be used. One good example is when you’re trying to acquire new users. Conversion rate can tell you how many people have seen your ads and how many of the same group of people downloaded your app.
In this case, the conversion rate can tell you whether your app page elements are designed in such a way that it convinces people to download your app.
If you’re getting a low conversion rate, meaning a lot of people are seeing your app but not downloading, then you might have the wrong screenshot, app icon, app preview, or app description.
All these can help you know how effective or abysmal your app store listing is.
4. Retention rate
Yes, people are downloading your app. However, do they keep it?
The retention rate will give you the answer.
With retention rate, you’ll know how many of your acquired users don’t uninstall your app.
Remember, you spend money on new users. You will be bleeding your fund if you’re just successful in convincing users to download your app, but not keep it.
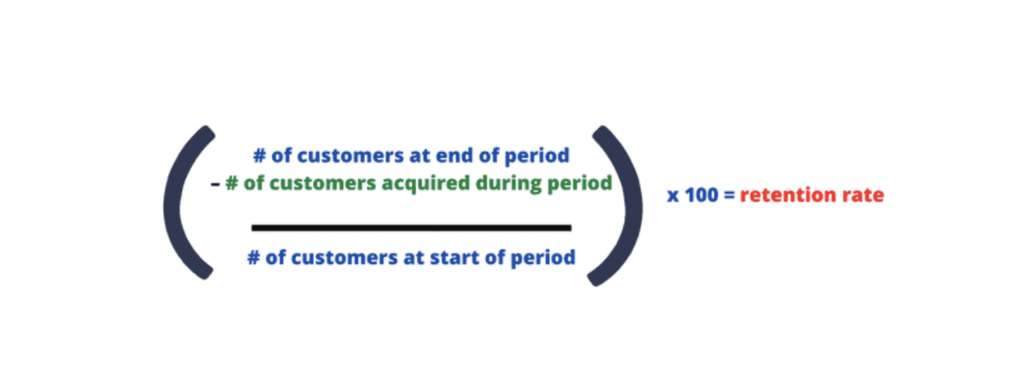
It is crucial that you know the retention rate. To calculate the retention rate, you can take the following steps:
- Determine the number of customers you have at the end of a given period, which can be a week, day, quarter, or year.
- Know the number of your new customers acquired in the same length of time.
- Subtract the number of your new customers from the number of customers you have at the end of a given period.
- Divide the difference by the number of customers at the start of the period.
- Multiply the dividend by 100.
These steps can be summarized by the following formula:
Just to give you an example, let’s say you had an existing 1,000 users at the end of a month. In the beginning, you had 950 users. In the same time period, you acquired 75 new users. The equation is as follows:

Aim to have a high retention rate to ensure your users are not leaving you. A low retention rate should be a warning sign that your app is losing its appeal.
Just a side note: the opposite of the retention rate is the churn rate. Still talking about the example above, the churn rate is 3%.
5. Active users
While it’s good that you’re seeing people downloading your app, it can be misleading. Letting the number of installs determine the success of your app might not draw a complete picture.
Remember, people can download your app. However, not all of them will continually use your app. That’s why you must measure daily active users (DAU) and monthly active users (MAU) as part of your app metrics for engagement.
By knowing your DAU and MAU, you can know how engaged people are with your app. Thankfully, app stores measure DAU and MAU for you.
6. Stickiness
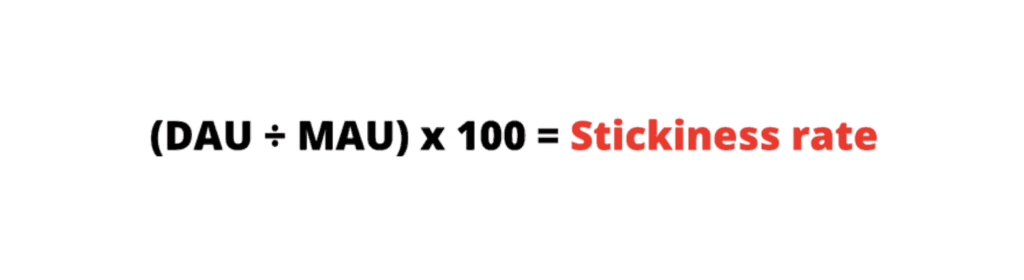
Stickiness measures how “sticky” your app is or in other words, how likely your users are going to use your app multiple times. Stickiness is an important app metric for engagement. It can give you an idea of how much value people see in your app.
Stickiness can easily be calculated. Simply divide DAU by MAU and then multiply by 100. The answer is expressed in percentages.
Generally speaking, the higher your stickiness, the higher the value of your app to your users. Apps with a high stickiness rate would most likely provide higher profit.
7. Crash rate
Do you like an app that crashes a lot? Obviously not. The same is true with your users. They want an app that does its job without crashing.
If you have a lot of crashes, you will chase away users. If there are a lot of errors or bugs, you’ll get bad reviews.
Crashes are also good indicators of the health of your app. If you get a lot of crashes, it’s time to diagnose your app and fix the problem as soon as possible.
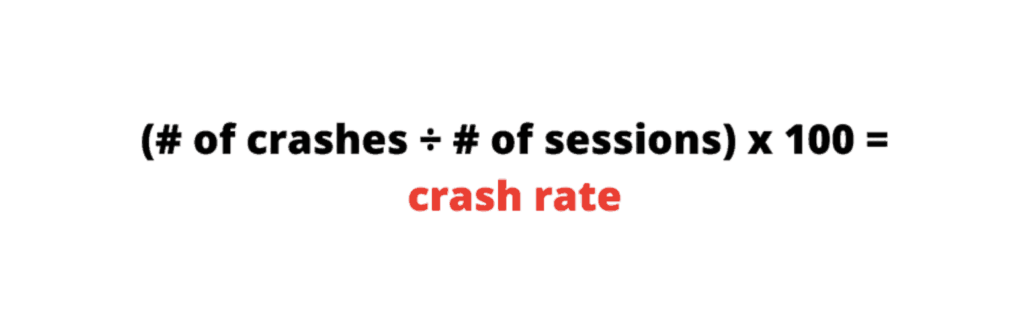
The easiest way to calculate crash rates is to simply count the number of crashes and divide that by the number of sessions. You multiply the dividend, then, by 100.
8. Cost per Install
Let’s face it: money is an important resource that you need to manage effectively. That’s why it is one of the most important metrics you need to know.
Cost per install is the amount of money you spend to get a specific number of installs. It is calculated by marketing cost divided by acquired users.
By knowing how much you are spending for every user you get, you’ll have a better idea of whether you are losing or earning money. You can aim to lower your cost per install as much as possible to increase your revenue.
9. Customer Lifetime Value
How do you know how much earnings you can get from each user? It is by calculating customer lifetime value (CLTV). The CLTV allows you to get an idea of how much you can expect to earn from one customer starting from the time they downloaded your app until they uninstall your app.
This is a crucial piece of app metric because it helps you anticipate how much you will be earning and if your current marketing effort is worth it or not. If you have low CLTV, it means that you are spending too much and you need to change your strategy.
10. Ratings
App stores have their own rating system and it is the best indicator of how well your app is doing overall. Obviously, the higher your rating is, the better your app performance is.
Ratings are the greatest app metric to gauge user experience. All your effort in creating an awesome app boils down to this.
What’s great about ratings is that they also come with reviews.
You can read reviews, both negative and positive.
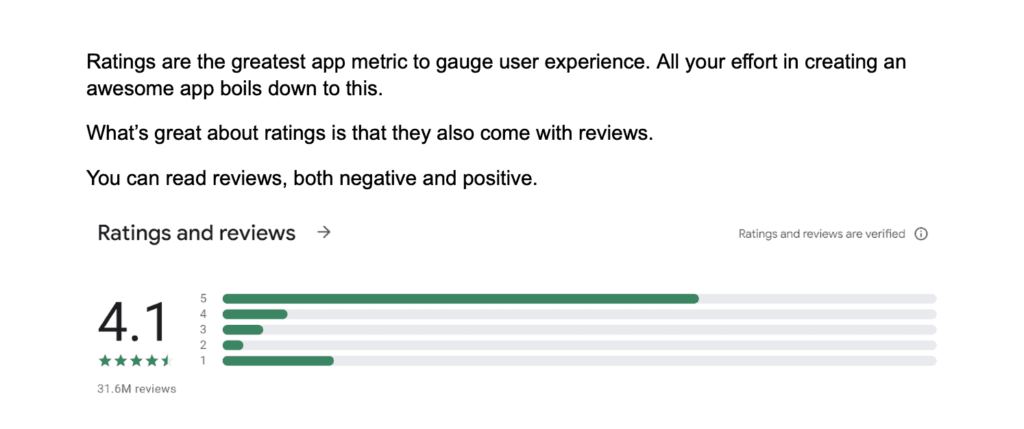
Image source: Google Play Store
Listen to your users. Usually, reviews can tell you how you can further improve your app. Plus, it highlights what the users like about your app, which you can capitalize on.
Improve your app performance metrics
While measuring app performance is crucial, it’s not enough. That’s just half of the work you need to do.
How do you interpret data? How can you use data to support the growth of your app? How can you create the right strategies, modify existing campaigns, and improve future marketing efforts?
All these questions can be answered with the ShyftUp.
ShyftUp is among the best user acquisition agencies across the globe that will help you gather important metrics to measure your app’s performance. Aside from that, they have the expertise and experience to use data in creating the best marketing strategies for you.
What are mobile app metrics?
Mobile app metrics are performance indicators that help you determine the success of your app. Metrics may include tracking retention rate, conversion rate, churn rate, number of installs and users, and ratings, just to name a few.
How do you measure mobile app performance?
The best way to measure mobile app performance is by having analytics tools. These tools and other pieces of software are available in app stores and some of them are offered by mobile app marketing companies. With the right tools, you can obtain important data for you to measure mobile app performance.
What are the 4 types of metrics?
For mobile apps, the four types of metrics are app metrics for acquisition, engagement, conversion, and evaluation. Each of these metric types is further subdivided into various more specific metrics.
