Overview of Mobile App Advertising Costs into 2022

Mobile advertisers and publishers quickly capitalized on the trend. They launched ad campaigns inside numerous mobile apps to accumulate new users and keep the revenue generator firing on all cylinders. The usual audience confusion came as developers joined the chase, striving to achieve the most compelling ad messaging at the lowest possible cost. A metric that quickly caught on was CPM – Cost-Per-Mile – another way of reflecting Cost-Per-Thousand. It has two primary benefits:
-
- To the advertisers – It signifies a specific mobile app’s cost per thousand impressions.
- To the publishers – It shows the revenue expectation for every 1000 impressions they serve.
It evolved into CPA (Cost-Per-Action) that zoned in on the crux of the matter – moving users toward a monetizing activity that gets the cash register ringing. However, publishers care most about average CPM rates because it connects to their revenue stream irrespective of the CPA. Moreover, they can’t analyze every user’s action landscape. In short, CPA involves fine-tuning that doesn’t resonate at the publisher level. Actions or no actions, publishers still get paid based on a rate per one thousand impressions (i.e., which CPM signifies).
There’s significant advertising rate diversion around in-app advertising costs when you dig down and look at rates categorized by:
- Industry
- Ad format (of which there are many)
- Channel of ad delivery
- Geography and Physical location
- Mobile OS
- Device type
- Peak hours or not
- Season
- Locations
The above is the tip of a complex iceberg with many rate configurations, including Cost-Per-Click (CPC) and eCPM. This article provides a practical guide, giving you industry statistics and spotlighting the average mobile ad CPM rates.
Note: As we alternatively refer to CPM and eCPM, we should explain the difference:
- CPM = Cost of 1,000 impressions valued before launching the ad campaign.
- eCPM = Same metric formula, but computed once the campaign reaches completion (translating from CPM, CPC, CPA, whichever measurement the advertiser used). As a result, there’s always some small variance between eCPM and CPM.
1. Key Mobile Advertising Data Statistics
A. Ad Expenditure Statistics:
2020
- Global: $276 billion
- USA: $98 billion
- Google: $147 billion
- Facebook: $84 billion
B. Global Statistics on Mobile App Advertising Rates:
2021 – IOS Rate Ranges
- Rewarded Video eCPM – $1.96 to $14.5
- Interstitial eCPM – $2.27 to $9.64
- Banner eCPM – $0.16 to $0.38
2021 – Android Rate Ranges
- Rewarded Video eCPM – $1.59 to $11.45
- Interstitial eCPM rates – $3.01 to $10.11
- Banner eCPM – $0.16 to $0.52
2021 – Facebook
- On Average: $14.10
With this broad overview, let’s look a little deeper.
2. Mobile Advertising Market Perspectives
A. CPM Revenues – An Historical Overview
There’s no doubt that the pandemic upset the applecart, disrupting mobile advertising forecasts and sending tremors through the entire digital world. For example, an October 2020 update by eMarketer dropped the US spend from $105 billion for the calendar year to $96 billion.
Many companies revised their budgets down, thus reducing some five percent. However, the wheels started churning soon after, and an industry revival was in the cards. Despite the many lockdowns, social distancing stops, and starts, 2021 is touching $117 billion in America – slightly off the original prediction of $123 billion (i.e., still a massively impressive number).
The latest forecasts for 2024 are up at $164 billion – still around four percent off the original predictions. However you want to look at it, the mobile advertising bandwagon is shooting down the tracks with a sustainable momentum that even a global crisis like COVID-19 couldn’t disrupt. Let’s enhance our perspective by comparing mobile advertising to other branches of the broader advertising activity.
B. Mobile Advertising versus Other Primary Forms of Advertising
Nothing demonstrates the eye-popping growth of an industry than comparing it to other primary vehicles for promoting products and brands. The following 2020 $ value multiples speak louder than a thousand words:
Advertising Spend Comparison of Mobile versus:
- TV – Mobile is approximately 60% bigger.
- Radio and print – Mobile is about 7.5 times the size of each.
- Other online (i.e., desktops and laptops) – Equally split (i.e., 50/50).
- Other online expected in 2022 – Mobile edging ahead (51/49).
At one time, TV was king of the media. However, with Netflix, Hulu, and other movie streamers impacting the entertainment markets, the ground under the channel has eroded considerably. Simultaneously, people and their smartphones are inseparable. According to a survey conducted in February 2021, close to fifty percent of the respondents confessed to around five-and-a-half leisure mobile hours daily (i.e., excluding smartphone use in the workplace). Another twenty-two percent owned up to spending an average of three-and-a-half three hours daily on their mobile device.
C. The USA Mobile Advertising Spend versus Other Countries (sourced from eMarketer)

The takeaway from the table above is that the USA is globally the most prominent mobile advertising spend arena, even though China is catching up with a population five times bigger. Moreover, the growth rate is mind-boggling in both countries:
- From 2013 to 2018, the USA has experienced 443% growth in five years.
- Based on the numbers coming through for 2020 – 908%.
- Representing an annual compound rate of 41% over 5 and 7 years.
- China’s growth from around only 10% of the USA’s value in 2013 is off the charts, reflecting:
- 70% of the USA’s value five years later.
- Astounding growth over five of 4500%.
- The UK, Japan, Germany, and Australia – per capita – also show gigantic growth strides.
The metrics underline that the two leading countries have captured the dynamics of mobile advertising. It’s akin to a tsunami-like communication revolution, embracing nearly two billion people.
D. An Overview of the Digital Advertising Arena by Category
For an even greater perspective, let’s zone in and examine the digital advertising landscape specifically. We derived these numbers from a reliable report executed by the Dentsu Aegis Network digital marketing agency in 2021 that concluded:
- Social media grew by:
- Close to 27% in 2019.
- Dropping off to around 16.5% in 2022 (expected) with a roller coaster ride in between. However, always in the healthy double-digit arena.
- Paid search (the domain of Google and Facebook) fared well, hovering around the 10% growth mark – expected to grow just less than 9% in 2022.
- Online video is in big demand – short few-second takes on brand representations – holding above 11% (expected for 2022).
- Display ads (7% for 2022) and classified (+4% in 2022) bring up the rear of the analyzed channels.
E. A Company by Company US Ad Revenue Overview (sourced at eMarket)
Here’s how things have shaken out in the mobile app industry. Suppose you’re a developer wanting to compete in a mainstream marketplace. In that case, the only genuine options are iOS (Apple) – The App Store, and Android – Google Play. When it comes to the mobile advertising arena, the two massive acts in town are Google joined by Facebook:
- The two owned over 60% of the ad revenue in 2019 from 54% only three years earlier.
- Google led by around 7.3% (i.e., 33.8% vs. 26.5%) in 2019, but Facebook is catching up fast, narrowing the deficit that stood at 9% in 2016.
- Other players are Yahoo, Twitter, Snapchat, Amazon, YP, and Pandora, with a combined total of just under 10%.
- In just three years (2016 – 2019), the ad spend through these companies leaped from $46 billion to $82.3 billion – an annual growth of approximately 25% compounded.
- There can be no doubt that we’re in a revolutionary device era cutting across app development and the promotional activity that flows beside it.
3. CPM Rates and Mobile App Advertising Rates 2022
A. Facebook
The Cost Per Mile rate for Facebook was $13.44 in March 2022 versus one year earlier $15.15. Both levels are significantly higher than in March 2020, when it dropped to $8.8 in response to the sudden realization that the world faced a pandemic. Then, around Christmas 2021, the CPM peaked at $20.70 (so much for the virus being a killjoy). So what’s so engaging about Facebook? Three gigantic features that attract advertisers:
- Generating Traffic
- Motivating App Installs
- Encouraging Video Views
Facebook’s average CPM across all industries was $14.40 in 2021 – an increase from 2020 ($11.54). Breaking it down by campaign types, it went as low as $2.28 (brand awareness) to as high as $30.97 (lead generation campaigns).
B. Android and iOS eCPM Rates
Let’s switch gears and talk about eCPM rates for major advertising networks.
1. 2021 Rewarded Video iOS eCPM Rates, by country
The data shows that the United States registers the highest eCPM of $14.2 – way ahead of Japan ($9.90), Australia ($8.30) – ranging down to Brazil at $3.10. China comes midway at $6.10.
2. 2021 Rewarded Video Android eCPM Rates, by country
(Source: Appodeal and Business of Apps)
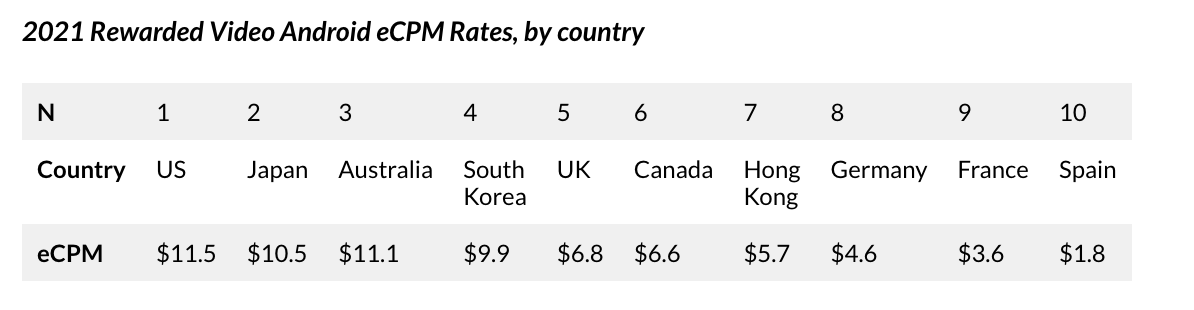
There’s not much change in the ranking order as reflected under (a) above, except Brazil gives way to Spain, and Hong Kong substitutes China. This category enjoys the highest demand from a CPM angle (and all other rate measurements), hence the loftiest prices.
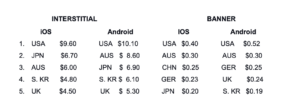
3. 2021 Interstitial iOS eCPM Rates, by country
4. 2021 Interstitial Android eCPM Rates, by country
The Interstitial ad format relies on advertisers building a dynamic mobile ad that takes up the host app’s entire interface. The rate comes in lower than Rewarded Video for one simple reason – there’s a lower CTR. See the rates from 1 to 5 for IOS and Android in the table below:
Source: Appodeal
5. 2021 Banner iOS eCPM Rates, by country
6. 2021 Banner Android eCPM Rates, by country
The eCPM rates around the banner format for iOS and Android connect to it being the least effective with the lowest CTR. Even the highest rates (i.e., the USA) are well south of $1. At the same time, it’s still around with moderate demand. See the table below for the top five countries under Interstitial and Banner rates.
Conclusion
The US Mobile advertising market is in a maturity stage – delivering excellent revenue streams to digital publishers and engaging advertisers. Mobile ad spending has accelerated over the past seven years, even through the pandemic, and it doesn’t look like stopping. In addition, many parts of the world are only entering early growth phases, providing exceptional opportunities for developers with an eye for international expansion.
Mobile ad eCPM rates are vivid barometers of the industry’s health, although they significantly vary category by category. Therefore, developers should keep a finger on the pulse by checking the trends regularly.
Talk to ShyftUp – a leading global User Acquisition Agency – to help you decide on the best seasonality strategy for your app portfolio. ShyftUp focuses on two primary services:
- App Store Optimization (ASO) – unleashing the power of organic user growth by creating boosted visibility on the app stores
- Paid User Acquisition – to help you grow your user base by converting your paid marketing budget into real users, thus revenue. Shyfttup specializes in Apple Search Ads and Google UAC channels.
How are In-App Advertising rates calculated?
A metric that quickly caught on was CPM - Cost-Per-Mile - another way of reflecting Cost-Per-Thousand. It has two primary benefits:
To the advertisers - It signifies a specific mobile app’s cost per thousand impressions.
To the publishers - It shows the revenue expectation for every 1000 impressions they serve.
How can advertisers maximize their revenue?
Publishers and advertisers can maximize their revenue by:
-Seamlessly interacting with the entire ad ecosystem.
-Competing for ad impressions in real-time.
-Providing a marketplace that’s easy to navigate.
1. Key Mobile Advertising Data Statistics
B. Global Statistics on Mobile App Advertising Rates:
2. Mobile Advertising Market Perspectives
A. CPM Revenues - An Historical Overview
B. Mobile Advertising versus Other Primary Forms of Advertising
Advertising Spend Comparison of Mobile versus:
C. The USA Mobile Advertising Spend versus Other Countries (sourced from eMarketer)
D. An Overview of the Digital Advertising Arena by Category
E. A Company by Company US Ad Revenue Overview (sourced at eMarket)
3. CPM Rates and Mobile App Advertising Rates 2022
1. 2021 Rewarded Video iOS eCPM Rates, by country
2. 2021 Rewarded Video Android eCPM Rates, by country
3. 2021 Interstitial iOS eCPM Rates, by country
4. 2021 Interstitial Android eCPM Rates, by country
5. 2021 Banner iOS eCPM Rates, by country
Subscribe to our Newsletter
