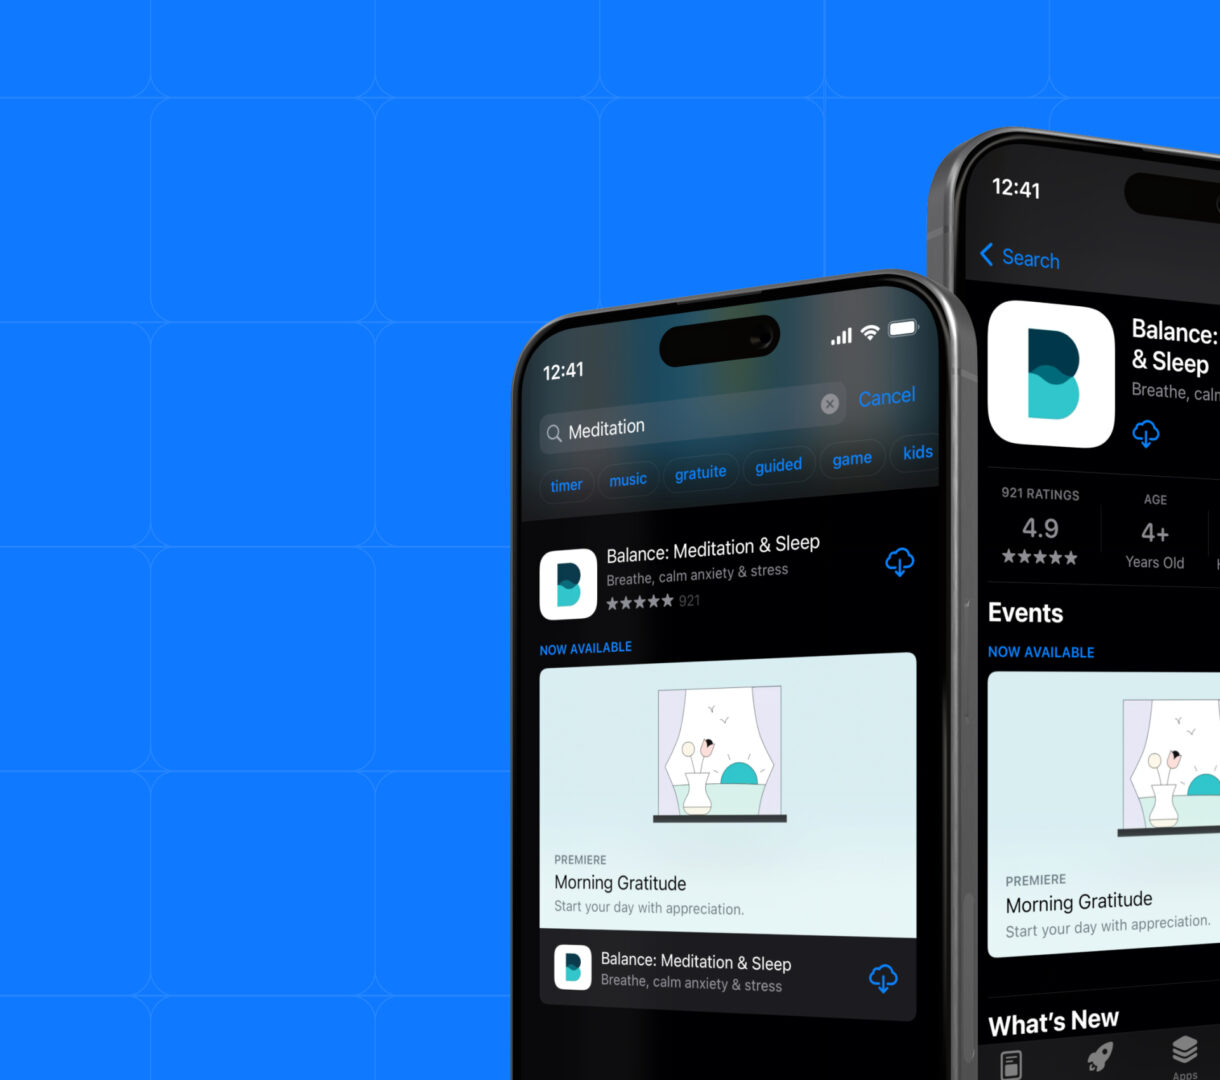

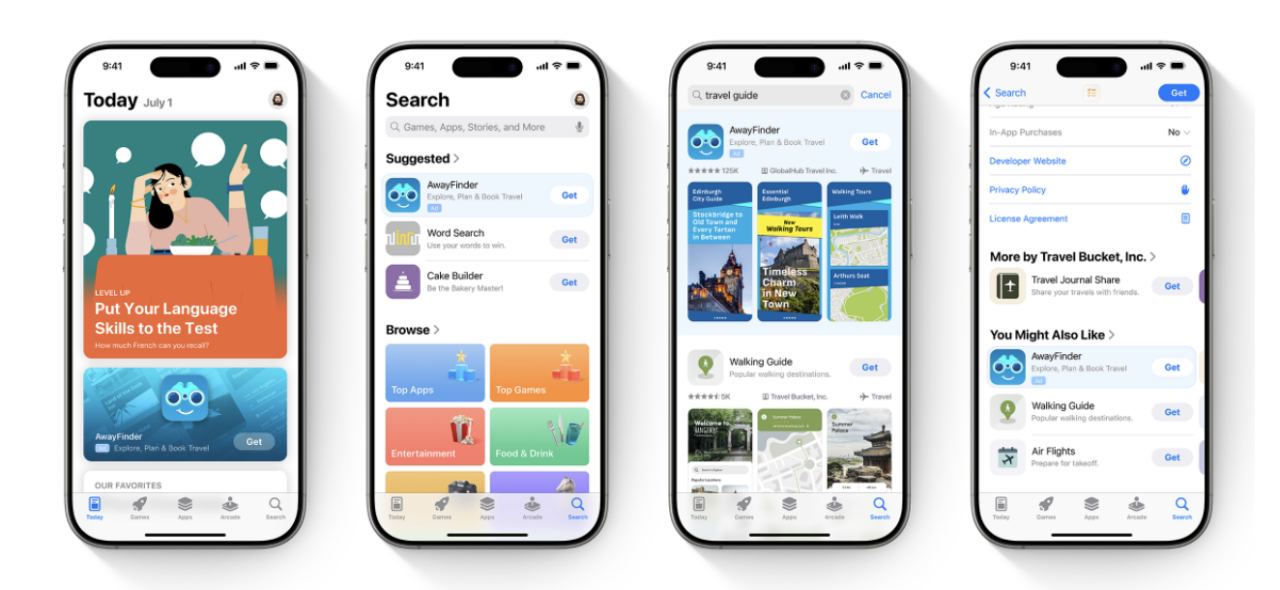
With over 1.8 million apps competing for attention in the App Store, getting discovered is harder than ever. That’s where Apple Search Ads (ASA) step in—placing your app directly in front of users who are actively searching. But here’s the truth: simply running an ASA campaign isn’t enough. If you’re just setting a budget and hoping for the best, you’re leaving serious growth (and money) on the table.
To unlock real results, you need to go deeper. You need to track performance, analyze key metrics, and optimize based on real data. That’s the power of Apple Search Ads tracking and analytics.
In this guide, we’ll answer the critical questions:
- How do you accurately track your ASA campaigns?
- Which metrics matter most?
- And how can you use this data to drive smarter, more profitable decisions?
Let’s break it all down and turn your ASA strategy into a precision engine for growth.
How to set up effective tracking for Apple Search Ads
Running Apple Search Ads is just half the battle—tracking performance is where the real optimization happens. Without clear insights, you’re flying blind. Here’s a step-by-step guide on how to track your ASA campaigns effectively and make informed decisions based on actionable data.
1. Set up your Apple Search Ads campaign
Before you can track performance, you need a properly structured campaign:
- Use Apple Search Ads Advanced, not Basic. This gives you full control over keywords, targeting, bidding, and analytics.
- Choose a specific campaign type (Search Results, Today Tab, Search Tab, or Product Pages).
- Avoid broad match or search match for better data clarity.
- Set exact match keywords, add negative keywords, and define your audience by age, gender, and customer type (e.g., new users).
- Establish a daily budget and track your spend-to-performance ratio.
Once your campaign is live, it’s time to start analyzing the results.
2. Access Apple Ads Performance Data
Head to your Campaigns Dashboard for a snapshot of all active campaigns. Here, you’ll access metrics like taps, impressions, spend, and various install types.
Want to dig deeper? Use the following dashboards and tabs:
- Ad Groups Dashboard – Review max CPT bids and CPA caps per ad group.
- Ads Dashboard – Evaluate ad-level performance.
- Keywords and Search Terms Tabs – See how each keyword is performing, adjust match types, and track individual CPTs and installs.
The Ad Placement column tells you where the ad appeared—crucial for identifying which placements are delivering the best ROI.
3. Add metrics to your dashboard
Customize your dashboards to focus on the metrics that matter most to your goals.
Here’s how:
- Click “Edit columns” on the right side of any dashboard (Campaigns, Ad Groups, or Keywords).
- Drag and drop your preferred metrics (e.g., Avg CPA, Taps, Installs, Spend) into view.
- Remove any clutter so you can quickly focus on your performance drivers.
This ensures you’re always seeing the KPIs that align with your objectives—whether it’s acquisition cost, tap volume, or install quality.
4. Filter the data in your dashboards
Filtering lets you isolate trends, spot issues, and pinpoint opportunities. Apple’s dashboards offer up to 20 customizable filters to tailor your view.
Available filter categories:
- General: Countries, Ad Placement, Campaign Status, Daily Budget
- Ad Groups: Max CPT bid, CPA Cap, Status
- Keywords: Match Type, CPT bid
- Search Terms: Match Source
- Performance: Spend, Taps, Installs, Impressions
- Advanced: New Downloads, Redownloads, View-Through vs Tap-Through
Use filters to:
- Find underperforming keywords that cost too much but deliver few installs.
- Identify high-ROI countries or demographics.
- Analyze specific date ranges, targeting periods of peak or low performance.
Save filters for quick access later—up to six combinations. Just click Save, name your filter, and reuse it as needed. You can also rename or delete saved filters anytime via the Filters menu.
By mastering ASA tracking and analytics, you transform guesswork into strategy. You’ll know where your budget is going, what’s driving installs, and where to adjust for higher performance.
Key metrics to analyze campaign performance
When it comes to optimizing Apple Search Ads, numbers don’t just matter — they tell the story of your campaign’s health. But not all metrics are created equal. To make smart, data-driven decisions, you need to understand which metrics to track, what they mean, and how they reflect your return on investment.
Here are the most important Apple Search Ads metrics to focus on:
1. Impression Share
Think of impression share as your visibility score. It measures how often your ad appeared compared to how often it could have appeared for your targeted keywords.
2. Impressions
This is the raw number of times your ad was shown in the App Store. It doesn’t mean users interacted with it — just that they saw it. Use this as a baseline to measure how well your ads are getting visibility across your selected placements.
3. Taps & TTR (Tap-Through Rate)
Taps measure how many people engaged with your ad by tapping on it. Tap-through rate (TTR) goes one step further — it tells you the percentage of users who saw your ad and tapped.
4. Spend & Average CPT (Cost-Per-Tap)
Your total spend is the cumulative cost of every tap your ad receives. Average CPT gives you a clearer picture of how much each of those taps is costing. This metric helps you determine if you’re overpaying for low-performing placements or keywords.
5. Installs (Tap-Through, View-Through, and Total)
- Tap-Through Installs happen when users tap your ad and install your app within 30 days.
- View-Through Installs occur when users see but don’t tap the ad — yet still download the app within 24 hours.
- Total Installs combines both. Tracking this trio helps you understand the different paths users take toward installation.
6. Average CPA (Cost-Per-Acquisition)
There are two versions here:
- Tap-Through CPA: How much you paid per install that resulted directly from a tap.
- Total CPA: Includes both tap-through and view-through installs.
Monitoring CPA is vital to knowing if your ad dollars are bringing in users at a sustainable cost.
7. Conversion Rate (CR)
- Tap-Through CR tells you what percentage of people who tapped actually installed your app.
Total CR includes users who installed after either a tap or a view.
These numbers reflect how well your ad and landing page are closing the deal.
8. New Downloads vs. Redownloads
- New Downloads show how many first-time users you’re acquiring.
- Redownloads reveal how many users are coming back after previously deleting your app.
Both are valuable but have different implications. If redownloads are high, consider whether you’re retaining users effectively post-install.
9. Average CPM (Cost-Per-Thousand Impressions)
This metric gives insight into how much you’re paying for exposure. While not always the most actionable, it’s useful for comparing campaign efficiency across markets or ad placements.
10. Search Terms & Match Source
Understanding what actual terms users typed in (and whether they came from your bidded keywords or Apple’s Search Match automation) can guide you in refining your keyword strategy and adjusting bids accordingly.
Master these metrics, and you’ll master your Apple Search Ads — turning spend into strategy and installs into growth.
How to leverage Apple Search Ads analytics for campaign optimization
This is where the magic of Apple Search Ads (ASA) really shines. Leveraging ASA analytics for campaign optimization means using real data to make smarter, more profitable decisions. Below is a breakdown of how to do this effectively:
1. Track the right metrics — not just any metrics
Start by monitoring the most meaningful KPIs that impact your campaign’s performance:
- Impression Share: Reveals how often your ads are showing vs. how often they could show. Low share? Consider increasing bids or targeting less competitive keywords.
- Tap-Through Rate (TTR): High TTR = your ad is compelling. Low TTR? Refresh your creatives or test more relevant messaging.
- Conversion Rate (CR): This is your return on attention. If people tap but don’t download, your product page may need work.
- Average CPA (Cost per Acquisition): Use this to measure profitability. Compare it with your app’s LTV to determine sustainable ad spend.
- New vs. redownloads: Distinguish between new user acquisition and users reinstalling your app. Optimize campaigns around your actual goal.
2. Use keyword-level data to adjust bidding and relevance
Your Keywords and Search Terms tabs are goldmines:
- Identify high-performing keywords and consider increasing bids to capture more impressions.
- Cut or lower bids on low-converting keywords to avoid wasting budget.
- Add negative keywords to block irrelevant traffic that burns through your spend.
Always use exact match for key terms and monitor performance closely.
3. Optimize creatives based on performance trends
Apple Search Ads allows you to test different screenshots or product page variations via Creative Sets or Custom Product Pages. Run A/B tests to find what resonates with your target audience.
4. Segment by audience for smarter targeting
Use filters and dashboard data to isolate:
- Devices (iPhone vs. iPad)
- Demographics (age, gender)
- Customer types (new users vs. returning)
Then, customize campaigns or creatives based on how each group behaves. For example:
- If 18–24-year-olds convert well, double down on them.
- If redownloads aren’t profitable, exclude returning users.
5. Monitor dayparting & scheduling opportunities
Look at hourly or daily performance trends in your dashboard:
- Run ads during times your organic ranking dips to maintain visibility.
- Pause or reduce budget during low-converting hours to stretch your budget further.
6. Overlay ASA data with other metrics
Use third-party tools like Appfigures to combine ASA spend with:
- Downloads
- Revenue
- Ratings
This helps you understand which keywords or campaigns lead to high-value users, not just volume.
7. Create and use saved filters for ongoing optimization
Apple lets you create up to 6 Saved Filters. Use them to:
- Monitor only high-CPA keywords
- Track specific regions or placements
- Quickly evaluate new user acquisition vs. redownloads
This speeds up your analysis and helps you spot trends faster.
Data without action is wasted insight. ASA analytics empower you to turn a “good” campaign into a top-performing, ROI-positive growth engine — if you know how to read and respond to the numbers.
Become an Apple Search Ads tracking and analytics master now
Apple Search Ads offer powerful tools to put your app in front of the right users at the right time — but the real success comes from how well you monitor your campaigns. By focusing on the right metrics, refining your keywords, improving creatives, and making data-driven decisions, you can turn a good campaign into a great one.
But if you feel overwhelmed or simply want to maximize your return faster, you don’t have to do it alone.
That’s where ShyftUp comes in. As a trusted user acquisition agency, ShyftUp specializes in helping mobile marketers like you get more users, drive higher-quality downloads, and boost your app’s performance across the board. Whether you’re just getting started or looking to scale, their expert team has the tools and experience to take your Apple Search Ads strategy to the next level.
Ready to grow your app? Contact ShyftUp today and discover how they can help you win in the app stores.
How to set up effective tracking for Apple Search Ads
1. Set up your Apple Search Ads campaign
2. Access Apple Ads Performance Data
3. Add metrics to your dashboard
4. Filter the data in your dashboards
Key metrics to analyze campaign performance
3. Taps & TTR (Tap-Through Rate)
4. Spend & Average CPT (Cost-Per-Tap)
5. Installs (Tap-Through, View-Through, and Total)
6. Average CPA (Cost-Per-Acquisition)
8. New Downloads vs. Redownloads
9. Average CPM (Cost-Per-Thousand Impressions)
10. Search Terms & Match Source
How to leverage Apple Search Ads analytics for campaign optimization
1. Track the right metrics — not just any metrics
2. Use keyword-level data to adjust bidding and relevance
3. Optimize creatives based on performance trends
4. Segment by audience for smarter targeting
5. Monitor dayparting & scheduling opportunities
6. Overlay ASA data with other metrics
7. Create and use saved filters for ongoing optimization
Become an Apple Search Ads tracking and analytics master now
Subscribe to our Newsletter
